OVERVIEW: Federal Spending, Taxes, Deficit
Federal Revenues
Federal Deficit
FEDERAL SPENDING
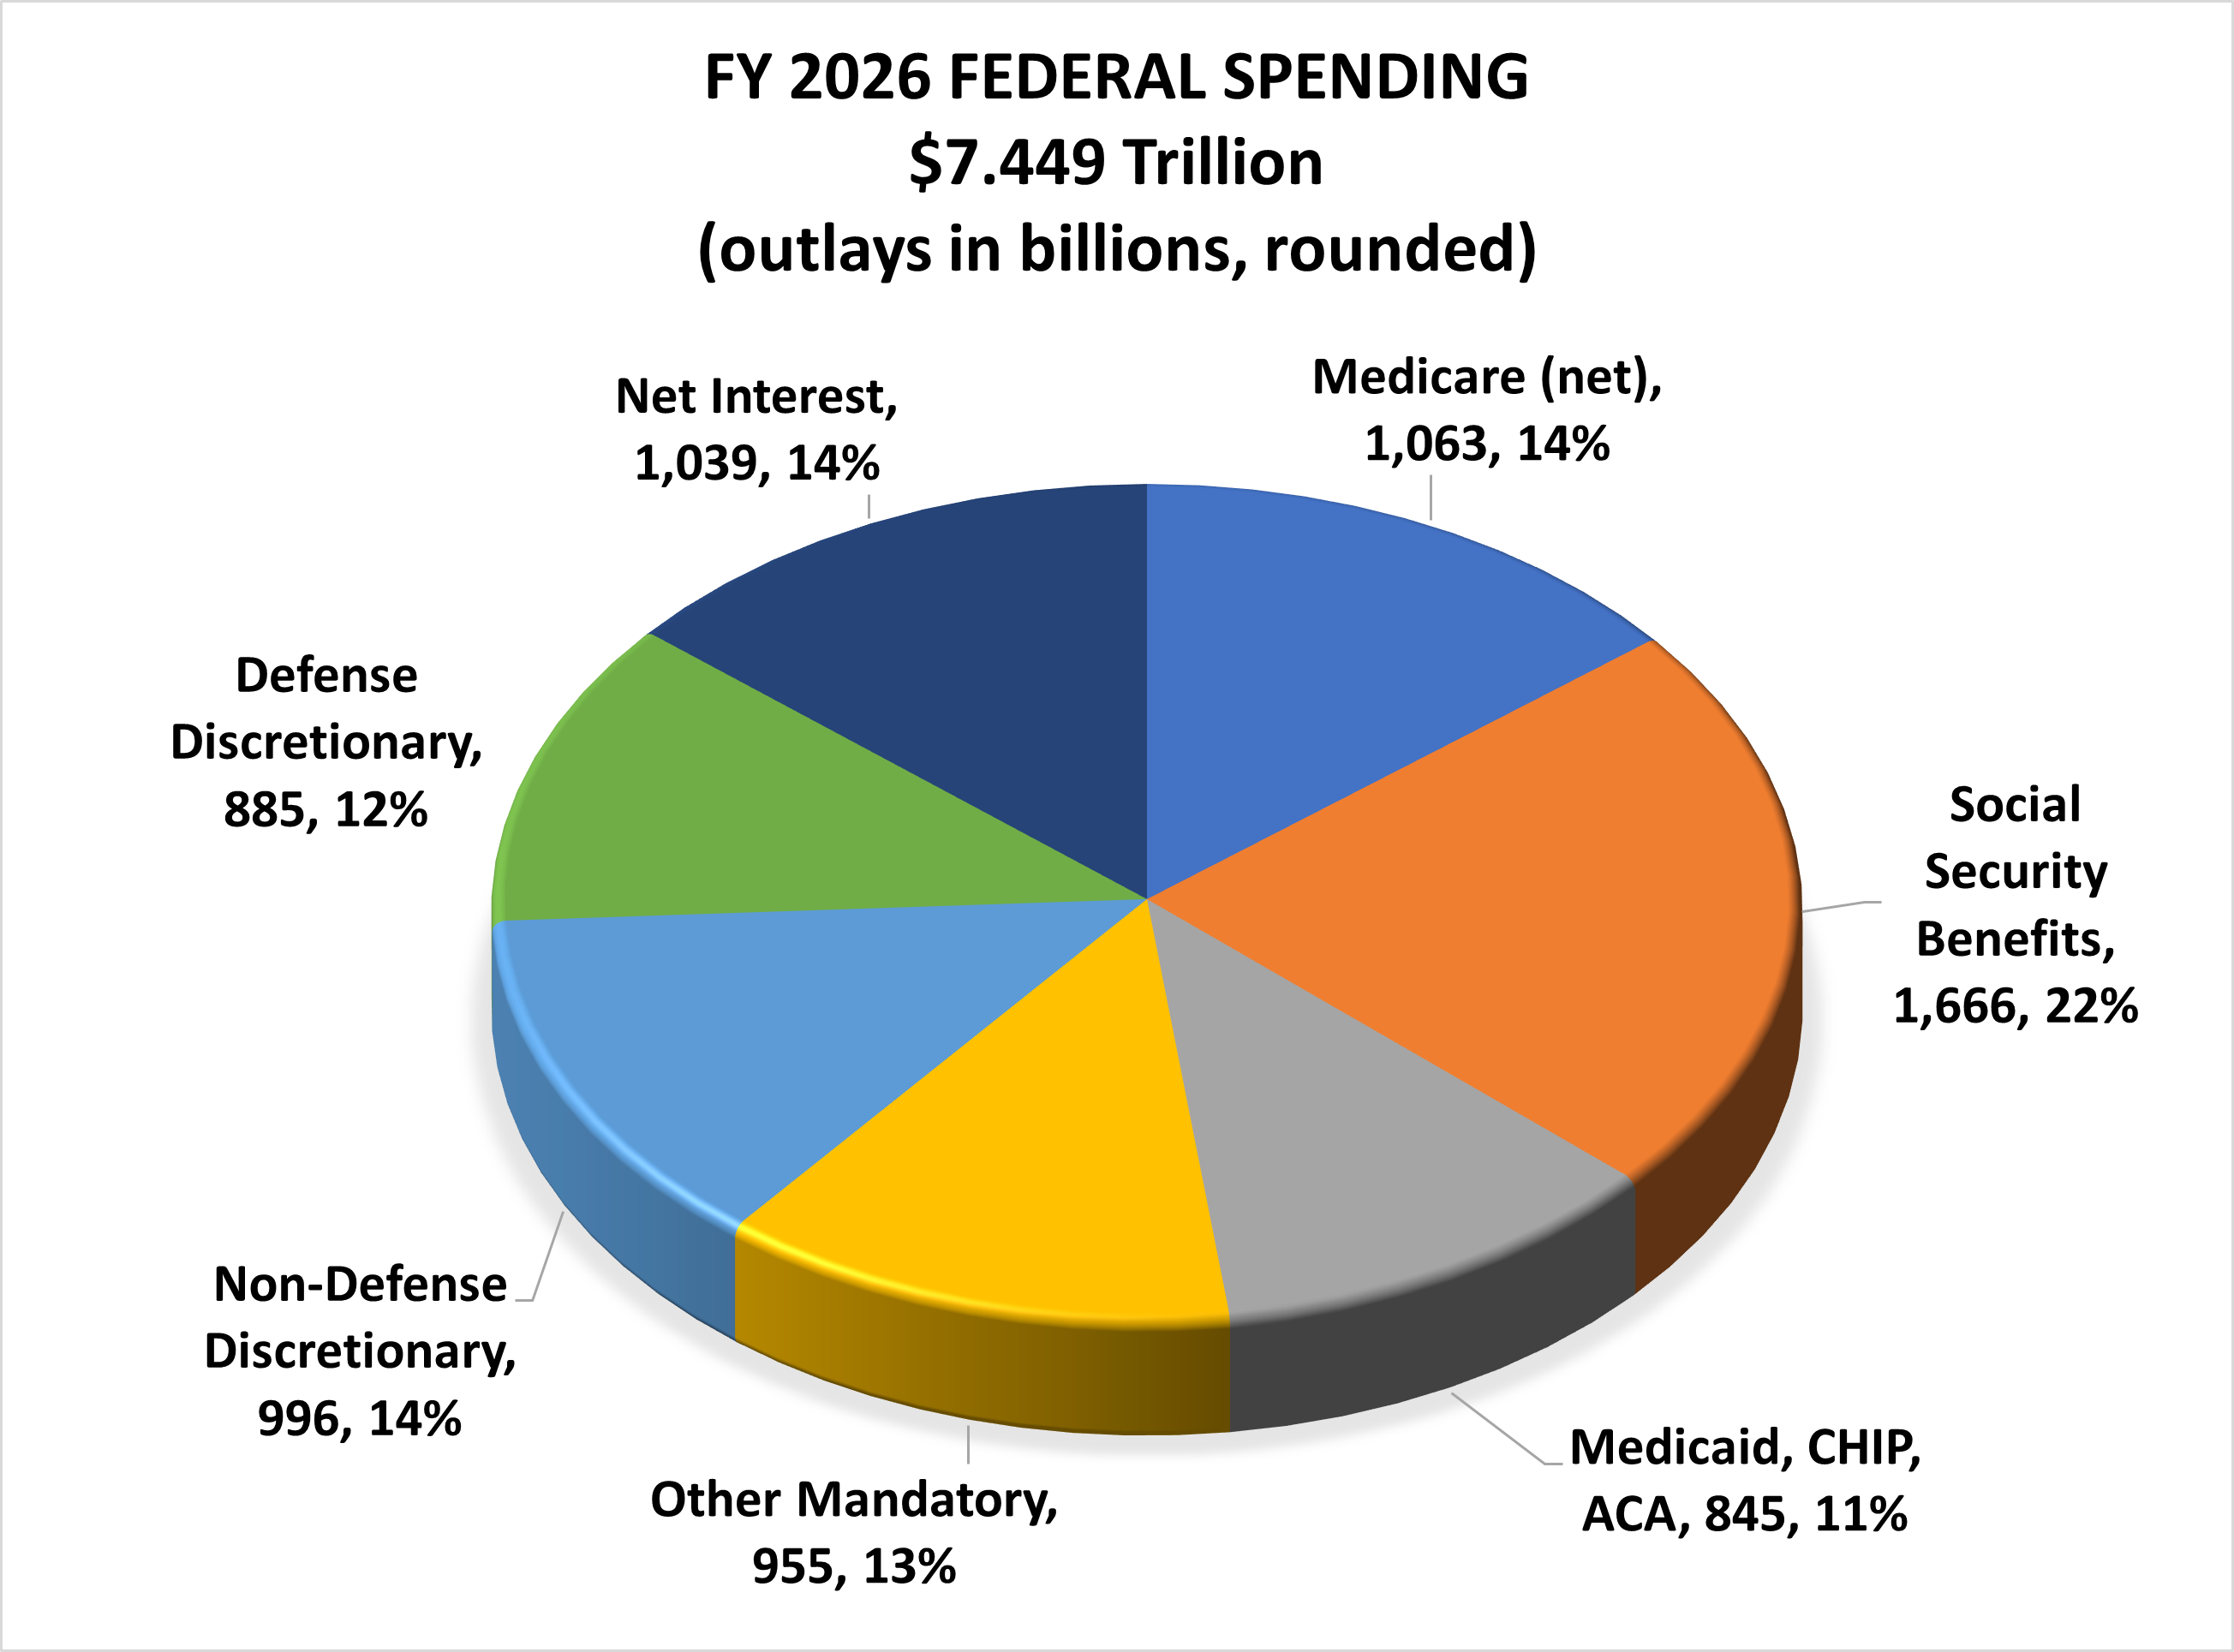
The federal budget divides more than $7 trillion in annual federal spending into three broad categories as displayed below:
discretionary spending;
direct spending (Social Security, Medicare, Medicaid and other mandatory spending); and
net interest payments on the debt.
Source: Congressional Budget Office, The Budget and Economic Outlook: 2026 to 2036
Discretionary Spending: 26% of the Budget:
About 26% of federal spending is called “discretionary spending,” because the amount of spending flows from annual discretionary funding decisions by the House and Senate Appropriations Committees.
Defense discretionary spending is $885 billion in outlays for FY 2026, or 12% of total outlays. It is funded by the Defense Appropriations Act and other appropriation laws that fund military construction and atomic energy. (The Department of Defense has also received an additional $150 billion in mandatory spending available through FY 2029 from the OBBBA law signed in July 2025).
Non-defense discretionary (NDD) spending is an estimated $996 billion in outlays for FY 2026 or 14% of total outlays. NDD is funded by the 11 non-defense appropriations laws. Non-defense discretionary spending has been trending downward, except for temporary increases due to the Great Recession and COVID-19 response efforts. NDD programs have fallen as a percentage of GDP from 3.9% of GDP in FY 2021, to 3.6% in FY 2022, 3.3% of GDP in FY 2023, 3.2% in FY 2025, 3.1% in FY2026, and is projected to be only 2.4% in FY 2036.
Direct (Mandatory) Spending: 60% of the Budget
The largest block of federal spending— about 60% and $4.520 trillion in FY 2026—is called “direct spending” because the outlays flow directly from legal obligations of the federal government established in authorizing laws. Direct spending is also referred to as “mandatory spending” because it is mandated by legal obligations written into permanent law (such as Social Security benefits).
Most direct spending is comprised of “entitlement programs”—where eligibility rules, benefit formulas and inflation adjustments enacted in permanent law determine annual outlays. Consequently, entitlements and other direct spending programs are on “auto-pilot” until underlying laws are changed.
The three largest entitlement programs, together comprising nearly half of the budget, are Social Security, Medicare and Medicaid.
Social Security: nearly $1.7 trillion in outlays and 22% of the budget, pays old-age, survivors, and disability benefits from payroll tax receipts and trust fund reserves.
Medicare: $1.2 trillion and 14% of the budget is the national health insurance program administered by the federal government for seniors and disabled adults, and financed by payroll taxes, premiums, copayments, and general tax revenues.
Medicaid: $708 billion in outlays and 10% of the budget, is the major health and long-term care program for low-income children, families, and seniors—financed jointly by the federal and state governments and administered by the states.
Net Interest Payments: 14% of the Budget and Rising
The third category of federal spending is “net interest,” which was $1.039 trillion in FY 2026, 14% of total federal outlays.
Because of the rapidly rising public debt, net interest is projected to become the fastest growing portion of the federal budget, increasingly crowding out available funds for defense and nondefense discretionary programs.
FEDERAL REVENUES
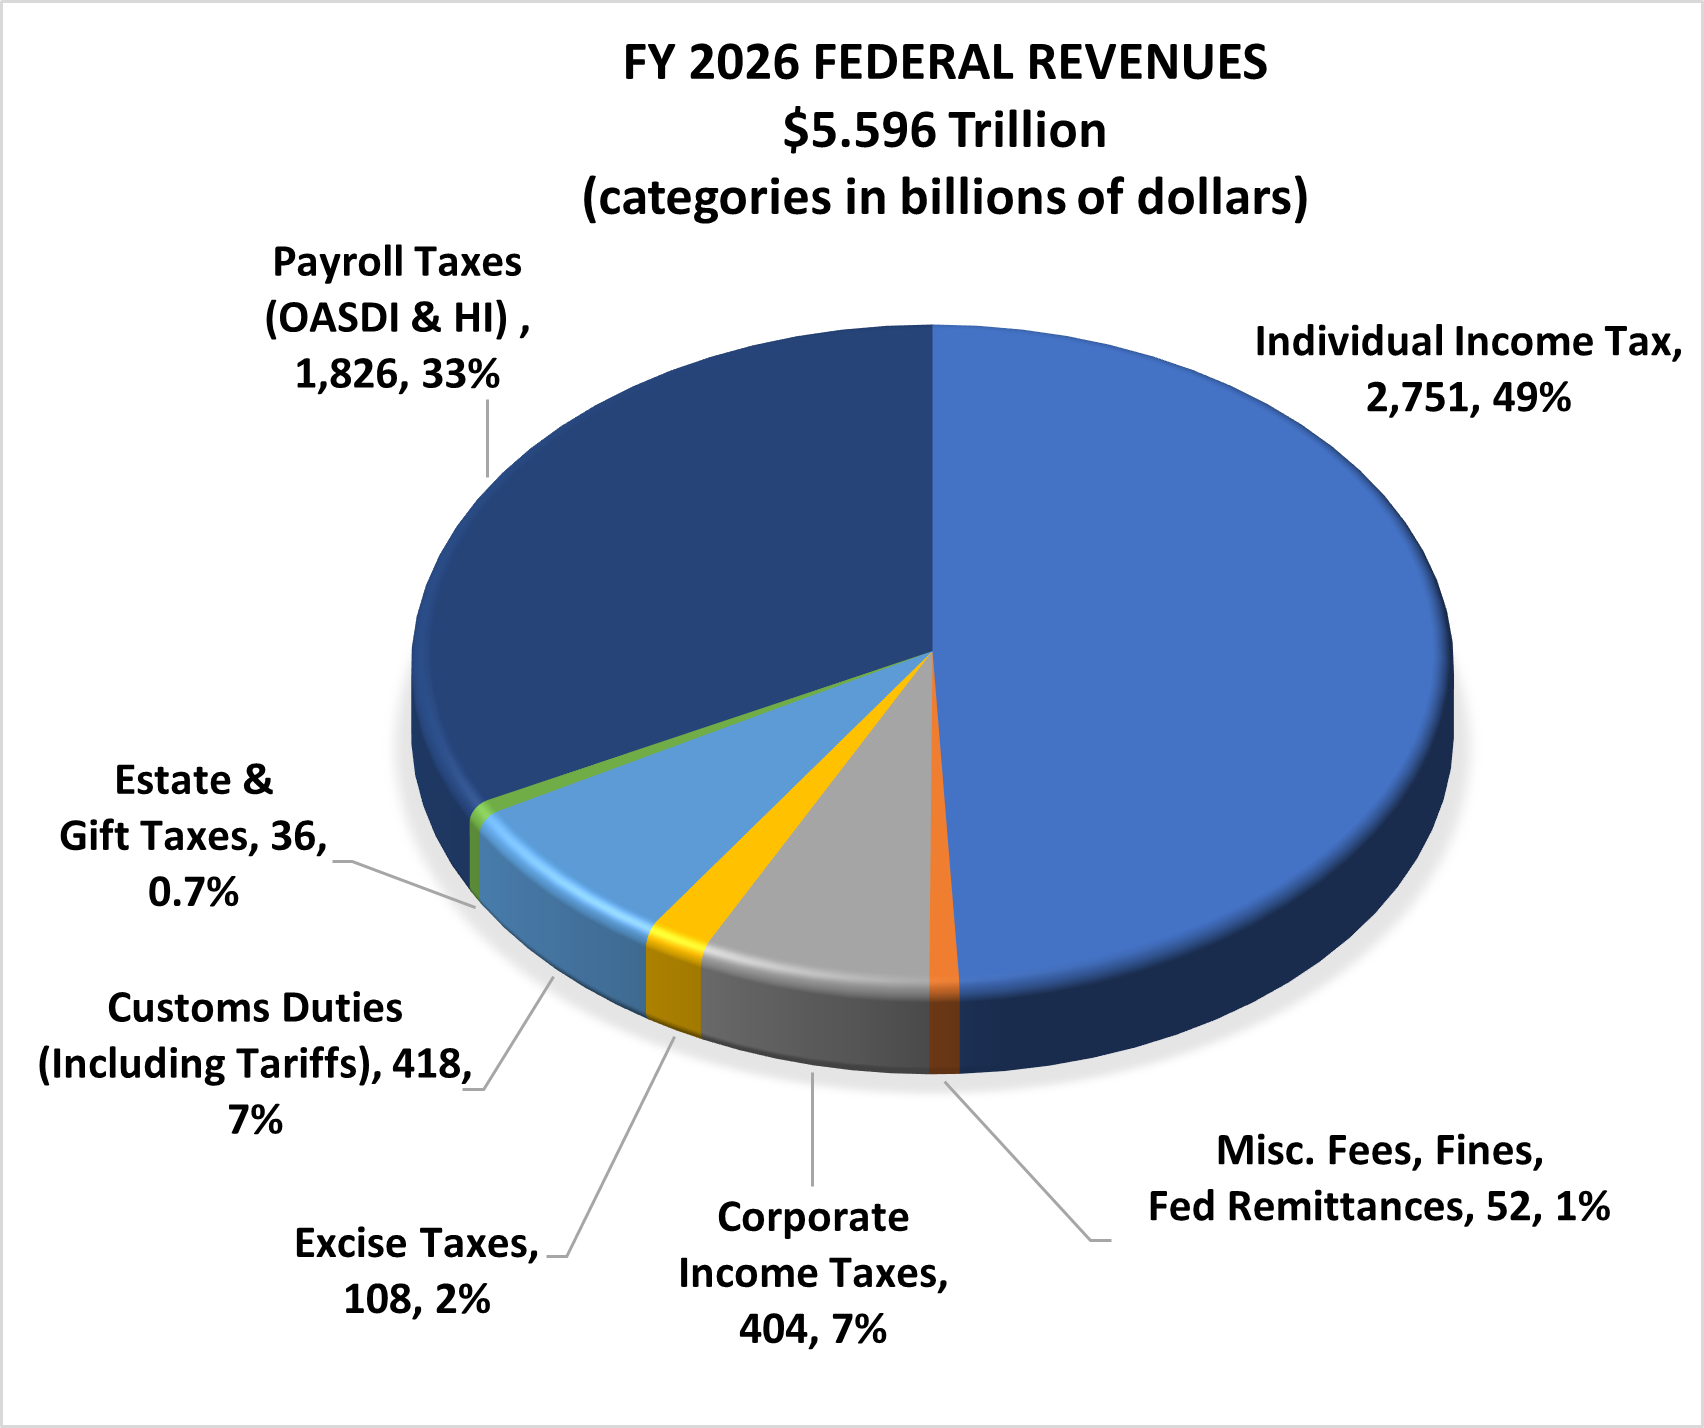
As displayed in the figure below, federal revenues consist of governmental receipts from the individual income tax, payroll taxes, corporate income tax, federal reserve remittances, excise taxes, custom duties (including tariffs), and the estate and gift tax. Revenues in FY 2026 totaled $5.596 trillion.
Source: Congressional Budget Office, The Budget and Economic Outlook: 2026 to 2036
Federal revenues fall under the jurisdiction of the House Committee on Ways and Means and the Senate Committee on Finance—two of the oldest committees of Congress. Ways and Means was first established in 1789 and became a standing committee of the House in 1802. Finance became a standing committee of the Senate in 1816. (The publisher of Trillions National Weekly served twice as General Counsel at the Finance Committee.)
Both committees have evolved into the most powerful committees of their respective bodies, with jurisdiction over taxes, tariffs and international trade, and nearly half of all federal spending, including Social Security, Medicare, and Medicaid. (Ways & Means shares jurisdiction over Medicaid with House Energy & Commerce.)
Congress’ revenue raising committees interact with the budget process in several important ways.
The Finance and Ways and Means Committees evaluate all tax proposals contained in the President’s Budget.
The congressional budget resolution includes a revenue floor. Any legislation from the tax-writing committees that would bring total projected federal revenues below the revenue floor is subject to a parliamentary objection.
The budget resolution may include reconciliation instructions to the Finance and Ways and Means Committees to report legislation that achieves specified amounts of revenue increases or decreases. If tax cuts are called for, they are constrained by the Senate’s Byrd Rule, which prohibits reconciliation bills from increasing deficits beyond the 10-year budget window. The effect of this restriction is to require, in effect, that tax cuts included in reconciliation bills expire after 10 years unless offset by spending cuts or revenue increases.
Statutory PAYGO requires, in effect, that any new legislation from the revenue-raising committees that would reduce revenues, must be offset by spending cuts or revenue increases in order to avoid triggering a sequester, although Congress has routinely enacted provisions to escape this restriction, for example, the 2025 tax cuts.
The House adopted a rule in 2025 for the 119th Congress aimed at impeding tax increases from the Ways & Means Committee by requiring a three-fifths vote to pass any measure that would increase federal income tax rates. (H.R. Res. 5 § 2(b), 118thCongress, amending House Rule XXI with a new clause 5(b).)
Income Tax: The individual income tax is the federal government’s largest source of revenue. The income tax is applied to income in seven brackets, from 10% up to 37%. The income tax generates 49% of federal government receipts in FY 2026, or $2.75 trillion. Click here for the current brackets.
Payroll Taxes: Payroll taxes raise 33% of Federal revenues for FY 2026 — $1.8 trillion. Payroll taxes consist primarily of Social Security taxes and Medicare Hospital Insurance (HI) taxes paid by employers and employees, as well as Unemployment Insurance Taxes paid by employers. Most low- and middle-income taxpayers pay more in payroll taxes than income taxes. The Social Security and Medicare HI payroll tax rates are, respectively, 12.4% and 2.9%— half paid by the employer and half by the employee (i.e., 6.2% and 1.45% each), with self-employed individuals paying the equivalent of both halves. Wages subject to the 6.2% Social Security payroll tax are capped at $184,500 in 2026, with the taxable maximum adjusted upward each year to reflect increases in average wages. The Medicare HI tax, unlike the Social Security tax, is assessed on all income.
Corporate Income Tax: A corporate tax of 21% is levied on corporate profits, i.e., taxable income after allowable deductions, credits, and other adjustments. The effective tax rate for corporations can be lower due to various types of deductions, subsidies, and tax preferences. Deductions include the cost of goods sold, general and administrative expenses, marketing, research and development, depreciation, and other operating costs. Companies opting to register as S-corporations do not pay corporate tax; instead, the income passes through to the business owners who are taxed through their individual tax returns. Beginning in 2023, the Inflation Reduction Act of 2022 imposed a corporate alternative minimum tax (CAMT) of 15% on the adjusted financial statement of large corporations (excluding Subchapter S corporations, regulated investment companies, and real estate investment trusts).
Customs Duties (Tariffs): Customs Duties (Tariffs) are taxes assessed on specified imports. Revenue from customs duties increased in 2026 due to global tariffs imposed by the Trump Administration (currently under review by the Supreme Court).
Excise Taxes: Excise Taxes are usually created to fund specific government activities. Operationally, they are levied on the production or purchase of particular goods or service. Excise taxes on gasoline, diesel fuel, and ethanol— about half of all excise tax receipts—flow into the Highway Trust Fund to pay for highways, bridges and mass transit. Excise taxes on airline tickets, aviation fuels, and aviation transactions fund the Airport and Airway Trust Fund to pay for airport improvements and other aviation services. Excise taxes on hazardous substances are dedicated to the Hazardous Substances Superfund to pay for cleanup operations. Fees on importers of brand-name drugs help to fund the Affordable Act. Other excise taxes to raise revenue are levied on tobacco and alcohol.
Estate and Gift Taxes: Estate and Gift Taxes are widely misunderstood due to political hyping of the “death tax.” Estate and gift taxes comprise less than one percent of federal revenues and 99.8 percent of Americans are effectively exempt from the estate tax due to the large lifetime exemption amount, $15 million for 2026. For the 0.2 percent of Americans subject to the estate tax, a 40 percent tax is applied to property transferred at death above the $15 million exemption amount. The federal gift tax operates alongside the estate tax to prevent individuals from avoiding the estate tax by transferring property to heirs before dying. For 2026, the first $19,000 of gifts from one individual to another is excluded from taxation and does not apply to the lifetime exemption. However, any amount over this annual exclusion lowers the effective lifetime estate tax exemption.
Miscellaneous Fees, Fines and Remittances: This category consists of miscellaneous fees, fines, and remittances from the Federal Reserve which includes income produced by the activities of the Federal Reserve System minus costs; most of this income results from interest on Treasury securities and mortgage-backed securities held by the Fed. This category also includes the Universal Service Fund fee which pays for expanding access to communication services, various user fees for government services, as well as fines and penalties.
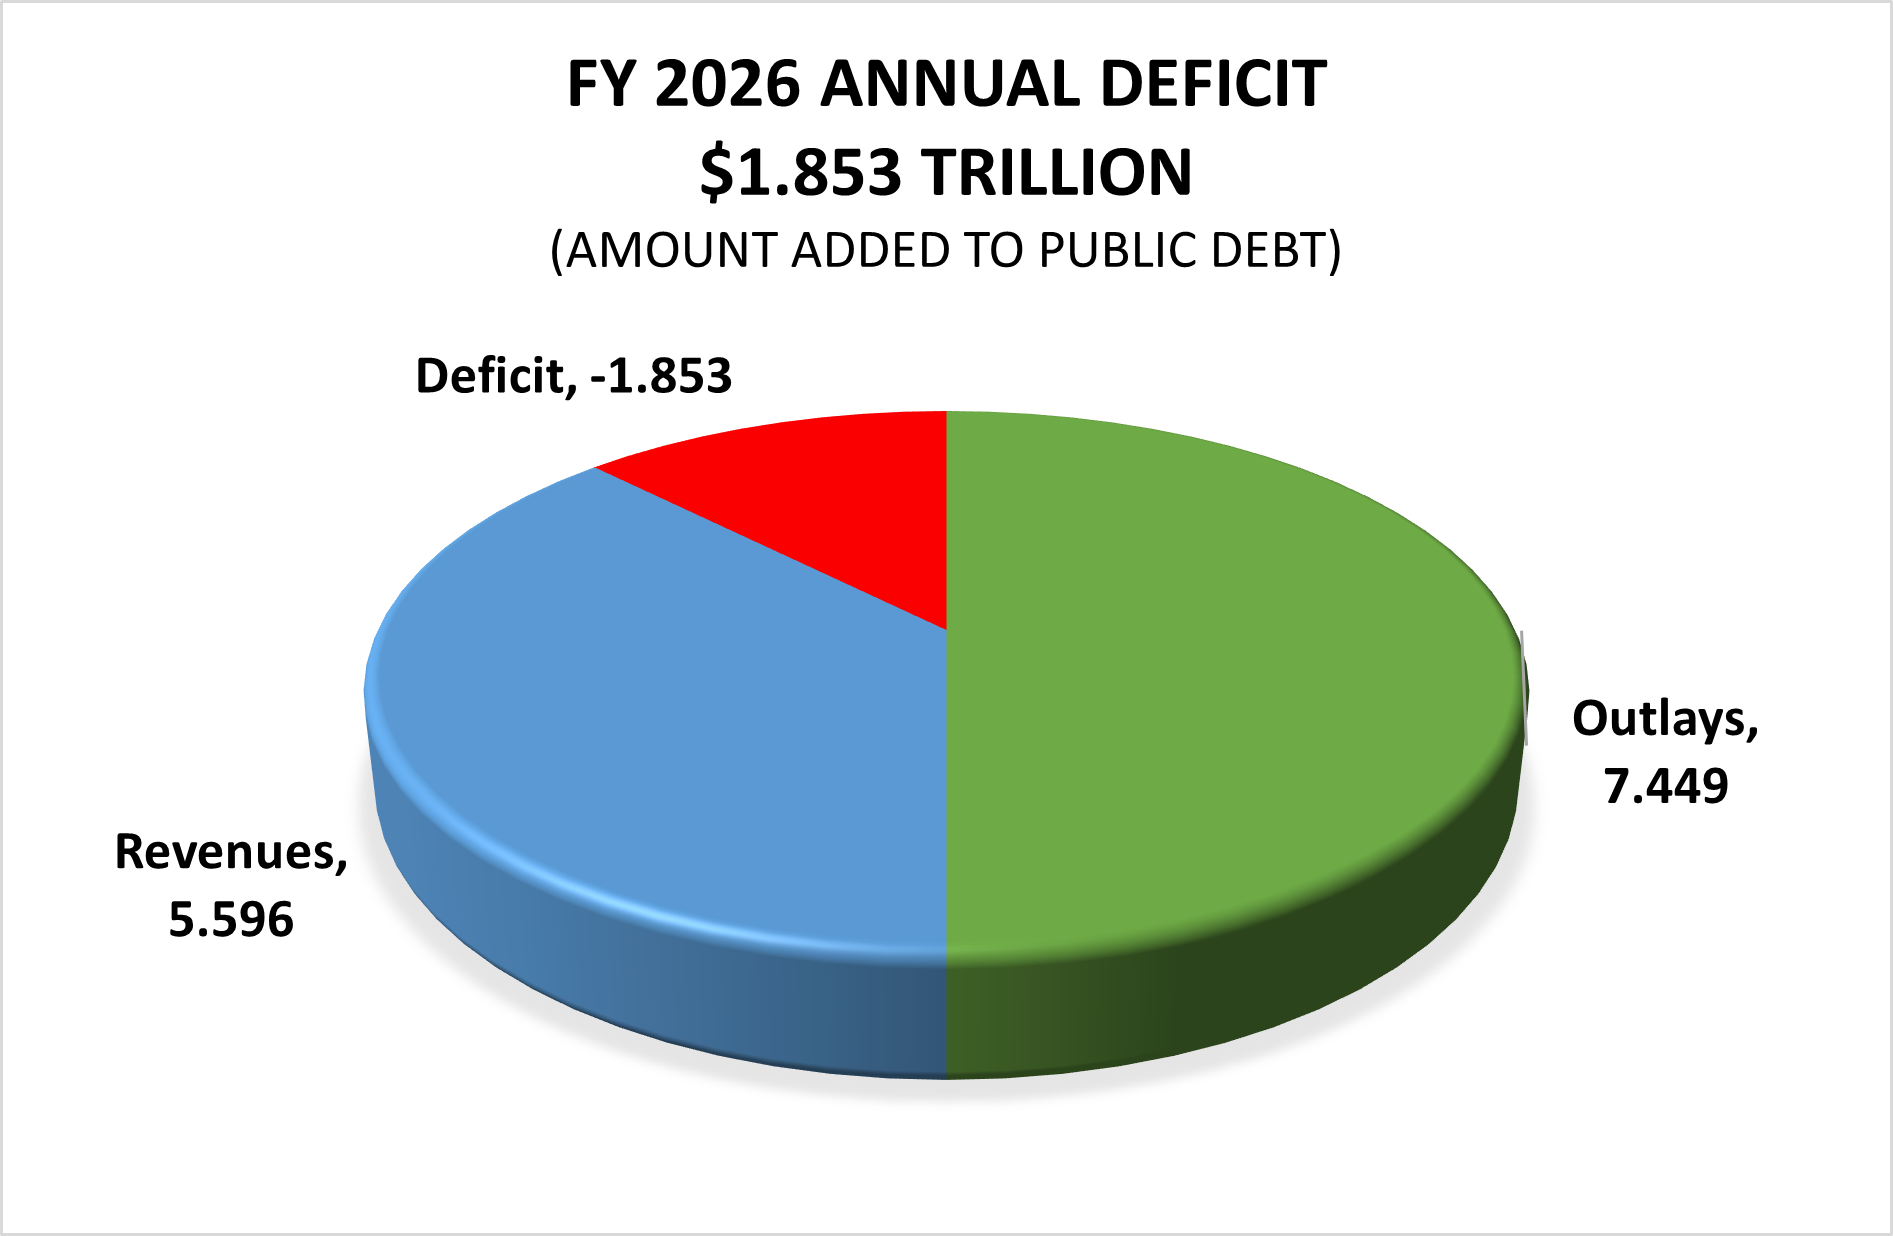
ANNUAL DEFICIT
The annual deficit of $1.853 trillion in FY 2026 is the amount by which federal spending is projected to exceed federal revenues. Each year the federal government runs an annual deficit, Treasury issues bonds to to finance the shortfall, and that amount is added to the accumulated public debt. For more background on the current national debt, link to our “Debt” page.
As you can see, there is no “extra cash” available from tariff receipts for payment of so-called “tariff dividends.” Tariff receipts have simply reduced, by a small fraction, the amount of money Treasury has to borrow in 2026 in order to cover the budget shortfall. Payment of “tariff dividends” or “tax rebates” in 2026 would increase the annual deficit and the accumulated public debt.